Installing Zabbix Proxy

Zabbix is my current favourite tool for monitoring an infrastructure, from a few services to many hundreds.  Have found one of the most useful features of the Zabbix architecture is its provision for Zabbix proxies.

A Zabbix proxy gathers the monitoring data, stores it in its local database and then forwards it to the central collection server. Example use if you have a set of servers inside a firewall that need to be monitored then setup a Zabbix proxy inside the firewall to collect the data from that set.  The proxy can then securely forwarded the collected data onto the central external monitoring server.

One major benefit it by having locally collected data, if the WAN connected between proxy and server became unavailable, data is not lost.

tip – setup a local agent on the proxy server to check for it’s availability/usage.


Zabbix Proxy configuration

The documentation of proxy setup is here:

http://www.zabbix.com/documentation/2.0/manual/distributed_monitoring/proxies

To setup a proxy server for Zabbix, followed these steps

  1. create my Centos VM
  2. using EPEL, installed  the package containing the proxy with mysql :
  3. The proxy server needs to connect to a database – this should not be the same as the one used by the Zabbix server.  Instead, use a local one, here i’m using mysql.
yum install zabbix20-proxy-mysql

start mysql and connect.
# mysql -uroot
mysql> create database zabbix character set utf8;
mysql> grant all privileges on zabbix.* to zabbix@localhost identified by 'zabbix';
mysql> exit

it will be necessary to load in the database schema, so change to the directory containing the downloaded sources and :

# mysql -uroot zabbix < schema.sql

As we are using mysql, now we need to amend the configuration file – zabbix_proxy.conf – to set the connections for the new database.

change sections to suit the local installation :

### Option: DBName
# Database name.
DBName=zabbix
### Option: DBUser
# Database user. Ignored for SQLite.
 DBUser=zabbix
### Option: DBPassword
# Database password. Ignored for SQLite.
DBPassword=zabbix
### Option: DBSocket
# Path to MySQL socket.
DBSocket=/var/lib/mysql/mysql.sock
# Option: DBPort
# DBPort=3306
  1. now start the proxy process
  2. [root@zabbixproxy ~]# service zabbix-proxy start
    Starting Zabbix proxy: [ OK ]

check the proxy log file for errors:

all being well, should see example:

20304:20130605:102118.705 Starting Zabbix Proxy (active) [zabbixproxy]. Zabbix 2.0.6 (revision 35158).
 20304:20130605:102118.706 **** Enabled features ****
 20304:20130605:102118.706 SNMP monitoring: YES
 20304:20130605:102118.706 IPMI monitoring: YES
 20304:20130605:102118.706 WEB monitoring: YES
 20304:20130605:102118.706 ODBC: YES
 20304:20130605:102118.706 SSH2 support: YES
 20304:20130605:102118.706 IPv6 support: YES
 20304:20130605:102118.706 **************************
 20308:20130605:102118.724 proxy #3 started [data sender #1]
 20307:20130605:102118.725 proxy #2 started [heartbeat sender #1]
 20315:20130605:102118.729 proxy #10 started [trapper #1]
  1. Next we’ll configure the central monitoring server to recognize the proxy.
    1. Login to the web interface and go to Administration -> DM.
    2. Click the Create Proxy button.
    3. On the new proxy form, enter the hostname of the proxy into the “Proxy name” field.
    4. Click the Save button
  2. Finally, on install Zabbix Agents as you would normally on the servers to be monitored from the proxy. In the Zabbix web interface, when defining a host monitored via the proxy, set the “Monitored by proxy” field on the host configuration form.

Zabbix audit session logins

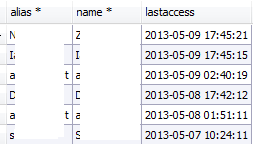
Recently needed to query the zabbix database running under mysql to obtain the last session logins per user. Zabbix stores all times since epoch  (Jan 1, 1970 00:00 GMT), so it will be necessary to convert these.    This page has useful formatting when using FROM_UNIXTIME example

select users.alias,users.name, FROM_UNIXTIME(lastaccess ,"%Y-%m-%d %T") AS `lastaccess` from sessions,users where users.userid=sessions.userid and lastaccess > (UNIX_TIMESTAMP(NOW()) -282800) order by lastaccess desc

output: zabbix_sessionaudit

Zabbix Server is not running

Occasionally, typically post a reboot of the Zabbix server, the message “Zabbix server is not running the information displayed may not be current” may appear.

zabbixserverisnotrunning

this is probably caused by selinux.

Run the following to see if selinux is preventing:
tail -f /var/log/audit/audit.log |grep -i avc

example of access denial

type=AVC msg=audit(1358942792.307:56): avc: denied { name_connect } for pid=2735 comm="httpd" dest=3306 scontext=unconfined_u:system_r:httpd_t:s0 tcontext=system_u:object_r:mys qld_port_t:s0 tclass=tcp_socket

if so, then turn off selinux or add a policy to allow it. I think it’s a bad idea to turn it off, especially when selinux is easy to configure. To do this, use commands getsebool & setsebool. To see a list of available attributes:
getsebool -a

the one we wish to use here is
httpd_can_network_connect

thus
[root@local]# getsebool httpd_can_network_connect
httpd_can_network_connect --> off
[root@local]# setsebool -P httpd_can_network_connect on
[root@local]# getsebool httpd_can_network_connect
httpd_can_network_connect --> on

Without the -P option, only the current boolean value is affected; the boot-time default settings are not changed.

If the -P option is given, all pending values are written to the policy file on disk. So they will be persistent across reboots.

ref http://linux.die.net/man/8/setsebool

Process information

today we have a system which kicked all users out of the system due to memory being flushed or so it seems.  Whilst yes we have monitoring and can see memory & cpu usage, we dont actually have post event visibility of the processes that caused this.

Both top and ps provide this information, but only if we capture it. Thus the following will grab the process information  covering both cpu, overall memory consumption as total % followed by actual values for  RSS & VSZ.

ps -A -o comm,%cpu,%mem,rss,vsz |sed 's/\(\w*\)\/\(\w*\)/\1/g'|awk 'NR==1 { print} NR!=1 {cpu[$1]+=$2;mem[$1]=$3;rss[$1]=$4;vsz[$1]=$5} END { for (i in cpu) {print i,cpu[i],mem[i],rss[i],vsz[i]}}'| sort -r +1 -2 -| head -6 | tail -5

example output

mysqld 8.6 83.8 27557052 29039096
puppetd 0 0.1 64416 174908
zabbix_agentd 0 0.0 412 52292
watchdog 0 0.0 0 0
vmw_pvscsi_wq_2 0 0.0 0 0

note, it reports back both the RSS (Resident Set Size) and VSZ (virtual memory size).  There is a flaw here, but in essence, VSZ will show the entire process size as available – but not necessarily loaded into physical ram, whilst RSS will show the approximate amount of physical memory currently loaded.

I mention RSS as being approximate memory size – be aware that it doesn’t include the page size for any shared libraries.

Zabbix Quick Start

Just recently I wanted to test out Zabbix frontend.  Zabbix helpfully produce a neat appliance which once installed as a VM then allows you to connect up clients.

I wanted to test the new Zabbbix EPEL products.

  1. first step, needed a dedicated VM.   Heading over to Fedora, downloaded a Centos live iso.
  2. once the iso was downloaded, flashed up a vm and have a virgin vm waiting for me within a few minutes.

being old-school prefer to work via a terminal prompt and leave the gui on the hypervisor (I’m using XenServer for my hypervisor, for a main reason that its very easy to install and simple to use.)

so after changing the keyboard to suit my needs, need to first enable ssh :
service sshd start
next, need to reference the EPEL repository
wget http://download.fedoraproject.org/pub/epel/6/x86_64/epel-release-6-8.noarch.rpm
rpm -ivh epel-release-6-8.noarch.rpm

installing zabbix agent is the next easy step :
yum install zabbix20-agent
followed by installing the web frontend :

yum install zabbix20-web-mysql

next, it will be necessary to change some entries in the php config vi /etc/php change :

  • Uncomment the date.timezone line and add your current zone, the list of time can be found here.
  • max_execution_time = 300
  • max_input_time = 300
  • post_max_size = 16M

save the file and then connect to the zabbix url http://localhost/zabbix/ next step will be then to configure the connection to the Zabbix server database

test the connection and if all is well, Zabbix will then ask you to complete the fields for the zabbix backend server.

the above configuration is written to file
/etc/zabbix/web/zabbix.conf.php

  • so if easier, modify that file. it may be necessary to restart the webserver to reflect the changes.

if the url fails to connect, then its possible :
1. firewall is precluding access – so configure iptables.  Example method I use is:

iptables -P INPUT ACCEPT
iptables -F
iptables -A INPUT -i lo -j ACCEPT
iptables -A INPUT -m state --state ESTABLISHED,RELATED -j ACCEPT
iptables -A INPUT -p tcp --dport 22 -j ACCEPT
iptables -A INPUT -p tcp --dport 80 -j ACCEPT
iptables -P INPUT DROP
iptables -P FORWARD DROP
iptables -P OUTPUT ACCEPT
iptables -L -v

/sbin/service iptables save

This executes the iptables init script, which runs /sbin/iptables-save and writes the current iptables configuration to /etc/sysconfig/iptables.

  • When you reboot, the iptables service will apply the rules saved in this file by using the iptables-restore command.

2. selinux is giving a problem. run the following to see if selinux is preventing:
tail -f /var/log/audit/audit.log |grep -i avc

example of access denial

type=AVC msg=audit(1358942792.307:56): avc: denied { name_connect } for pid=2735 comm="httpd" dest=3306 scontext=unconfined_u:system_r:httpd_t:s0 tcontext=system_u:object_r:mys qld_port_t:s0 tclass=tcp_socket

if so, then turn off selinux or add a policy to allow it. I think it’s a bad idea to turn it off, especially when selinux is easy to configure. To do this, use commands getsebool & setsebool. To see a list of available attributes:
getsebool -a

the one we wish to use here is
httpd_can_network_connect

thus
[root@local]# getsebool httpd_can_network_connect
httpd_can_network_connect --> off
[root@local]# setsebool httpd_can_network_connect on
[root@local]# getsebool httpd_can_network_connect
httpd_can_network_connect --> on

so simple – start to finish, took less than 20minutes!

Tomcat & remote access

I’m using Centos for our production application servers, running Tomcat6.

now the application are working, need to monitor their state – in this example, the servers are all on the same network – see note on JmxRemoteLifecycleListener when using firewalls
exampl

So need to allow remote connections to the tomcat servers.
Default Configuration data is in file –  /etc/tomcat6/tomcat6.conf

Required basic Parameters

-Dcom.sun.management.jmxremote
-Dcom.sun.management.jmxremote.port=xxxxx
-Dcom.sun.management.jmxremote.ssl=false
-Dcom.sun.management.jmxremote.authenticate=false

just add the the above into the conf file and restart the tomcat service. eg

CATALINA_OPTS="-Dcom.sun.management.jmxremote -Dcom.sun.management.jmxremote.port=10001 -Dcom.sun.management.jmxremote.ssl=false -Dcom.sun.management.jmxremote.authenticate=false"

however, this isn’t exactly secure…

to achieve this, add the following lines

-Dcom.sun.management.jmxremote.authenticate=true \
-Dcom.sun.management.jmxremote.password.file=$CATALINA_BASE/conf/jmxremote.password \ 
-Dcom.sun.management.jmxremote.access.file==$CATALINA_BASE/conf/jmxremote.access \
  • create the password and access files if they don’t exist

example contents for jmxremote.access :

monitorRole readonly 
controlRole readwrite

Apache Server Status

Apache allows us to grab usage statistics

example
Apache Server Status for 192.168.1.80
Server Version: Apache/2.2.15 (Unix) DAV/2 PHP/5.3.3
 Server Built: Feb 13 2012 22:31:42
 Current Time: Tuesday, 26-Feb-2013 17:25:26 GMT
 Restart Time: Tuesday, 26-Feb-2013 17:25:00 GMT
 Parent Server Generation: 0
 Server uptime: 26 seconds
 Total accesses: 19 - Total Traffic: 6 kB
 CPU Usage: u0 s0 cu0 cs0
 .731 requests/sec - 236 B/second - 323 B/request
 1 requests currently being processed, 7 idle workers

The default location for these is http:/localhost/server-stats

Enable server stats

to enable change the apache httpd.conf (/etc/httpd/conf/httpd.conf)

1. Enable line:
ExtendedStatus On

2. uncomment server stats section :

SetHandler server-status
Order deny,allow
Allow from 127.0.0.1
Deny from all

  • amend the above to suit local requirements.

check the change config file:

[root]# apachectl configtest

Syntax OK

3. once changed remember to restart the http server :service httpd restart

So, now we’ve grabbed the data, what can we do with it?    Using wget, we can grab the data and pass that onto a monitoring system for subsequent trend or alerting.

I’m using Zabbix to monitor which when configured gives me this example graph:

zabbix_apache_example

Method

to achieve this,  choose a method from the Zabbix wiki :

For simplicity, i’m using Method 3

Apache Server

1. down load the script & template from above wiki link.
2. copy the shell script to required path – here i’m using /etc/zabbix/externalscripts
3. on the machine running apache, append to the agent conf file

UserParameter=apache[*],/etc/zabbix/externalscripts/zapache.sh  \$1

4. Restart the zabbix agent : service zabbix-agent restart

Zabbix Server

a good tip before enabling importing any template and subsequent triggers is on the zabbix server use zabbix_get  to check the configuration works.

eg zabbix_get -s [servername] -p 10050 -k apache[Uptime]

1. import the download template
2. assign the template to the apache server
3. check for incoming data/errors etc.
4. create any required graphs

Zabbix Netstat

Required to get back netstat data from the linux clients.

to achieve this, added this line to the agent file

UserParameter=netstat.stat[*],(netstat -$1|grep -i $2|wc -l)

and then restarted the agent.

Then just added lines to the respective template :
netstat.stat[ntp,active]

egnetstat_established

which then can be put into a graph :
netstat_graph_example

So by using the above key parameters it allows me to use for any command set of netstat and filter on the result set. Should in theory work on Windows o/s also.